WebSphere - generating heap, thread and core dumps manually
We have a performance problem with a Java application installed on IBM WebSphere. What should we do? First of all, data collected in so-called dump files is useful in the analysis.
To solve a performance problem, generating dump files only makes sense while the problem is ongoing. These files store the "current" state of the JVM (Java Virtual Machine), they do not store the history of performed operations. Therefore, generating files after a "crash" event will not help us in its analysis.
We have three types of dump files that we can get when performance problems occur:
- Heap dump - a dump of the memory space used by the JVM.
- Thread dump (thread dump, javacore) - a dump of running threads.
- System dump (core dump) - a dump of operations performed by the process within the operating system.
How to perform a manual file dump? Below are the simplest methods in my opinion.
Using the WebSphere Integrated Solutions Console
We launch the WebSphere Integrated Solutions Console in a browser (available at https://<server_name>:<port>/ibm/console, where <port> is most often the value 9043).
Configuration path in the WebSphere console: Troubleshooting > Java dumps and cores
Select the server that has the performance problem.
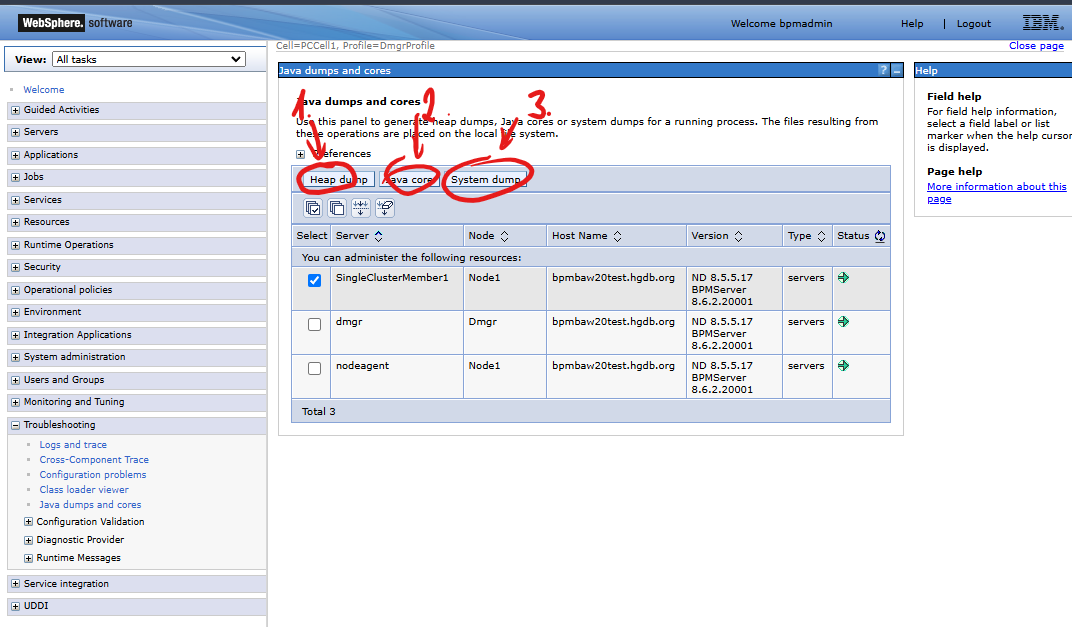
The following illustration shows the elements of the console page:

- Heap dump - clicking the button will dump the memory space used by the JVM.
- Java core - clicking the button will dump the running threads.
- Core dump - clicking the button will dump the operations performed by the process within the operating system.
Watch a video where I demonstrate the action of taking a dump of running threads on a WebSphere server:
Using the command line (SSH)
In case we do not have access to the WebSphere web console, we can take dumps from the command line.
Let's assume that our WebSphere server is running on Linux. It is installed in the /opt/IBM/WebSphere/AppServer directory.
The administrative username is bpmadmin and the password is secret.
Heap dump using wsadmin
We will execute the following commands to dump the heap:
- Start the
wsadminconsole:
cd /opt/IBM/WebSphere/AppServer/bin
./wsadmin.sh -user bpmadmin -password secret
- While logged in to the
wsadminconsole, we set thejvmvariable to the object representing the JVM for the application server, for example,SingleClusterMember1:
wsadmin>set jvm [$AdminControl completeObjectName type=JVM,process=SingleClusterMember1,*]
- We perform a heap dump:
wsadmin>$AdminControl invoke $jvm generateHeapDump
Thread dump (javacore) using wsadmin
We will execute the following commands to dump threads:
- Start the
wsadminconsole:
cd /opt/IBM/WebSphere/AppServer/bin
./wsadmin.sh -user bpmadmin -password secret
- While logged in to the
wsadminconsole, we set thejvmvariable to the object representing the JVM for the application server, for example,SingleClusterMember1:
wsadmin>set jvm [$AdminControl completeObjectName type=JVM,process=SingleClusterMember1,*]
- We perform a thread dump:
wsadmin>$AdminControl invoke $jvm dumpThreads
Thread dump (thread dump, javacore) using kill
The easiest way, however, is to dump threads using the kill command, sending an appropriate signal to the running JVM process.
To dump javacore (thread dump) we use the 2 signal, we issue the command:
kill -2 <PID>
To dump javacore, systemcore and Snapshot file we use signal 6, issue the command:
kill -6 <PID>
where <PID> is the JVM process identifier, which can be read from the file <server_name>.pid located in the directory profiles/<profile_name>/logs/<server_name>,
example: profiles/Node1Profile/logs/SingleClusterMember1/SingleClusterMember1.pid. The PID can also be read using the command ps -ef | grep java.
Useful links and materials
The following links lead to IBM support pages, where you will find more information about generating dumps in IBM WebSphere. To access them, you must have an account on the IBM service:
- How to manually generate a Heapdump in WebSphere on Windows.
- How to generate javacores/thread dumps, heapdumps and system cores for the WebSphere Application Server Liberty profile.